Patterns
The key elements of technical analysis of financial markets are patterns. A pattern is a fixed formation depicted by a price line of a certain trading instrument (currency pair) on its chart. Forecasts and estimates of future price movements are made based on patterns.
A complex and universal program code and a large volume of uploaded models can recognize graphical patterns when they are only appearing. There are various patterns of technical analysis.
Below you can find the most widespread ones.
Trends and channels
Trend channels

Accurately determined trend channels identify the approximate range of quote changes alongside with the trend. A channel represents two parallel lines drawn through three price extremes. The lower border of a bullish channel runs through two lower extremes, while the upper line of a bearish channel runs through two higher extremes.
Support and resistance levels

Support and resistance levels are the key levels of price movements. At these levels, sellers and buyers enter the market with a volume enough to stop or reverse a trend. These price levels are used to define who will most likely enter the market, sellers or buyers.
Trend continuation patterns
Flag

A bearish flag is a pause in the trend formed on a strongly pronounced uptrend. It resembles a small parallelogram tilted to the upside. When the price goes below the lower channel of the bearish flag, it signifies a downtrend, as a rule.
Symmetric Triangle

A bearish symmetric triangle is formed on a downtrend when the trend fades. The range of fluctuations narrows. It is considered that after an ascending symmetric triangle is formed, the price has already breached its lower level. Such a breach stands for continuation of a downtrend. The breach of the triangle’s upper level means the cancellation of a pattern.
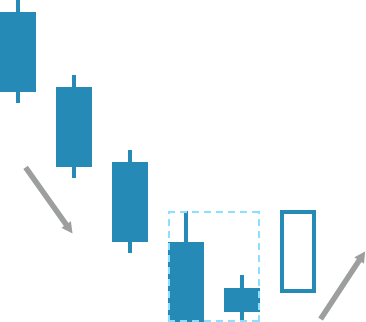
Rectangle

A bearish rectangle is formed on an downtrend when the price is consolidating right before the continuation of an downtrend. The breach of the lower bound of the rectangle usually means that the downtrend will be resumed. The breach of the upper bound means cancellation of the bearish rectangle.
Pennant

An abrupt price move which is depicted as almost straight vertical line usually precedes the pennant formation. After that the pennant is formed during consolidation phase.
Reversal patterns

Head and Shoulders

The Head and Shoulders pattern is formed on the trend’s peak and acts as a signal to the trend reversal. This pattern consists of 3 consequent tops, with the highest one in the middle, while two on the sides are located at the same level slightly below the middle top.
Double Bottom

Double Bottom is one of the most popular patterns to illustrate a reversal of the downtrend to an uptrend. The figure consists of two almost equal lows with a moderate peak in-between. Sometimes, the Double Bottom is called W as it resembles the shape of this letter of the English alphabet.
Triple Bottom

Triple Bottom is the reversal pattern of technical analysis which consists of three equal lows and is a bellwether of the price growth. The Triple Bottom resembles the Double Bottom with the difference that it has one more low.
Countertrend candlestick patterns
Morning star
The Morning Star formation consists of three candlesticks. The first candle is bearish with a long real body. It is followed by the second candlestick that can be bearish or bullish with a small real body. The third candle is bullish; it closes above the midpoint of the bearish candle’s body. This candlestick pattern may be found when the price of a trading instrument is moving in a downtrend. The opposite reversal pattern formed in an upward trend is called the Evening Star. The only difference between these two formations is that bullish candlesticks turn into bearish and vice versa in the Evening Star pattern.
Doji Star
The Doji Star represents a reversal pattern comprised of one candlestick with a long body followed by a Doji candle with a short body (or without any body at all) and short shadows. There must be some gap between the candlesticks, which is a crucial characteristic in recognizing this formation. The Doji Star pattern itself does not confirm a trend reversal. It only suggests a possible market scenario. For a definite confirmation of a trend reversal, one of the following bars must open lower than it would in an upward trend. If that is the case, either the Morning Doji Star or the Evening Doji Star will appear. Please note that the Doji Star is considered to send a much stronger signal than a traditional Star pattern.
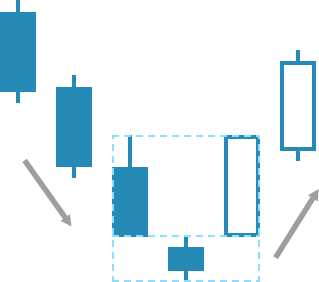
Harami
The Harami candlestick pattern represents a combination of two candles, in which one candle with a small body is contained within the long real body of the preceding candle. This formation is the direct opposite of the Engulfing pattern, where the long candlestick “engulfs” the body of the preceding candle. When the Harami occurs after a downside trend, it indicates trend weakness. If you spot this pattern on top following a long-term upward trend, it means that the trend is weakening and may soon reverse. The color of the smaller candlestick in the Harami pattern is not important.
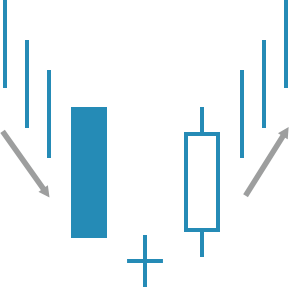
Hammer

The Hammer is a candlestick formation comprised of a single candle. The characteristic features of the Hammer pattern include a long lower shadow and a short real body. This graphical model can easily be identified on a chart as its shape resembles a hammer. The Hammer is a bullish reversal pattern formed in a downside trend. The Hammer that occurs after a price drop indicates that the price has hit the bottom, which means that it will reverse and start growing any time soon. The long lower shadow of the formation suggests that sellers have kept the price at its lowest point for a long time, but buyers finally managed to overcome the pressure. As a result, the price of the instrument closed near the opening price.
Engulfing
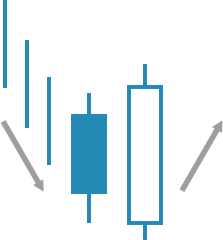
The Engulfing is a reversal pattern that consists of two candlesticks (one is white and the other is black), where the second candle’s body “engulfs” the body of the first candle. When there is a strong trend, especially if oscillators are indicating that the market is in an overbought or oversold condition, this pattern signals a trend reversal. In this case, the signal is much more powerful than in other reversal candlestick formations. Bullish engulfing is formed in a downside market pressure, when the white candle “engulfs” the body of the black candle. Conversely, bearish engulfing occurs in an upward market, with the black candle dominating the white candle. If the second candle engulfs not just one candle body, but the bodies of a few preceding candlesticks, the signal pointing to an upcoming trend reversal is the strongest.
Harami Cross

The Harami Cross is a reversal pattern formed by two candlesticks. The first candle has a long body while the second candlestick is a Doji (a candle with no real body). If there is a strong trend in the market, the Harami Cross formation does not only suggest that there is some uncertainty among investors, but it also points to an upcoming trend reversal. The Harami Cross pattern provides clearer signals than the traditional Harami. When this pattern appears near support or resistance lines as well as near the trend line, it can be interpreted as an even stronger signal. The Harami Cross can either be bullish or bearish depending on the preceding trend.